How it works
Connect, collect, and the graph is drawn. Everything after that is a way of reading the same graph: three views and a brief.
1. Connect
A workspace holds connections: a HubSpot portal by private-app token, a GitHub account for the repositories that hold your scripts, a Google Cloud project for scheduled jobs and functions. Each connection is one credential, scoped to read definitions. The HubSpot token alone gives most teams their whole picture.
2. Collect
A collect reads every workflow, form and list, and for each one records the fields it enrolls on, reads, branches on and writes, including writes that land on an associated record rather than the enrolled one. The stage collector reads the ordered values of your pipeline fields and where each property is filed. Collects run on a schedule and each one leaves a log you can open.
3. The graph
The unit is an edge: this automation, this field, this direction. Everything else falls out of that. A field with several deciding writers is contested. A field one system writes and another reads is a bridge. Two automations that trigger on each other's writes are a loop. A graph that says a field has no readers also carries the coverage that licenses the claim, and says so when it cannot.
4. The structure
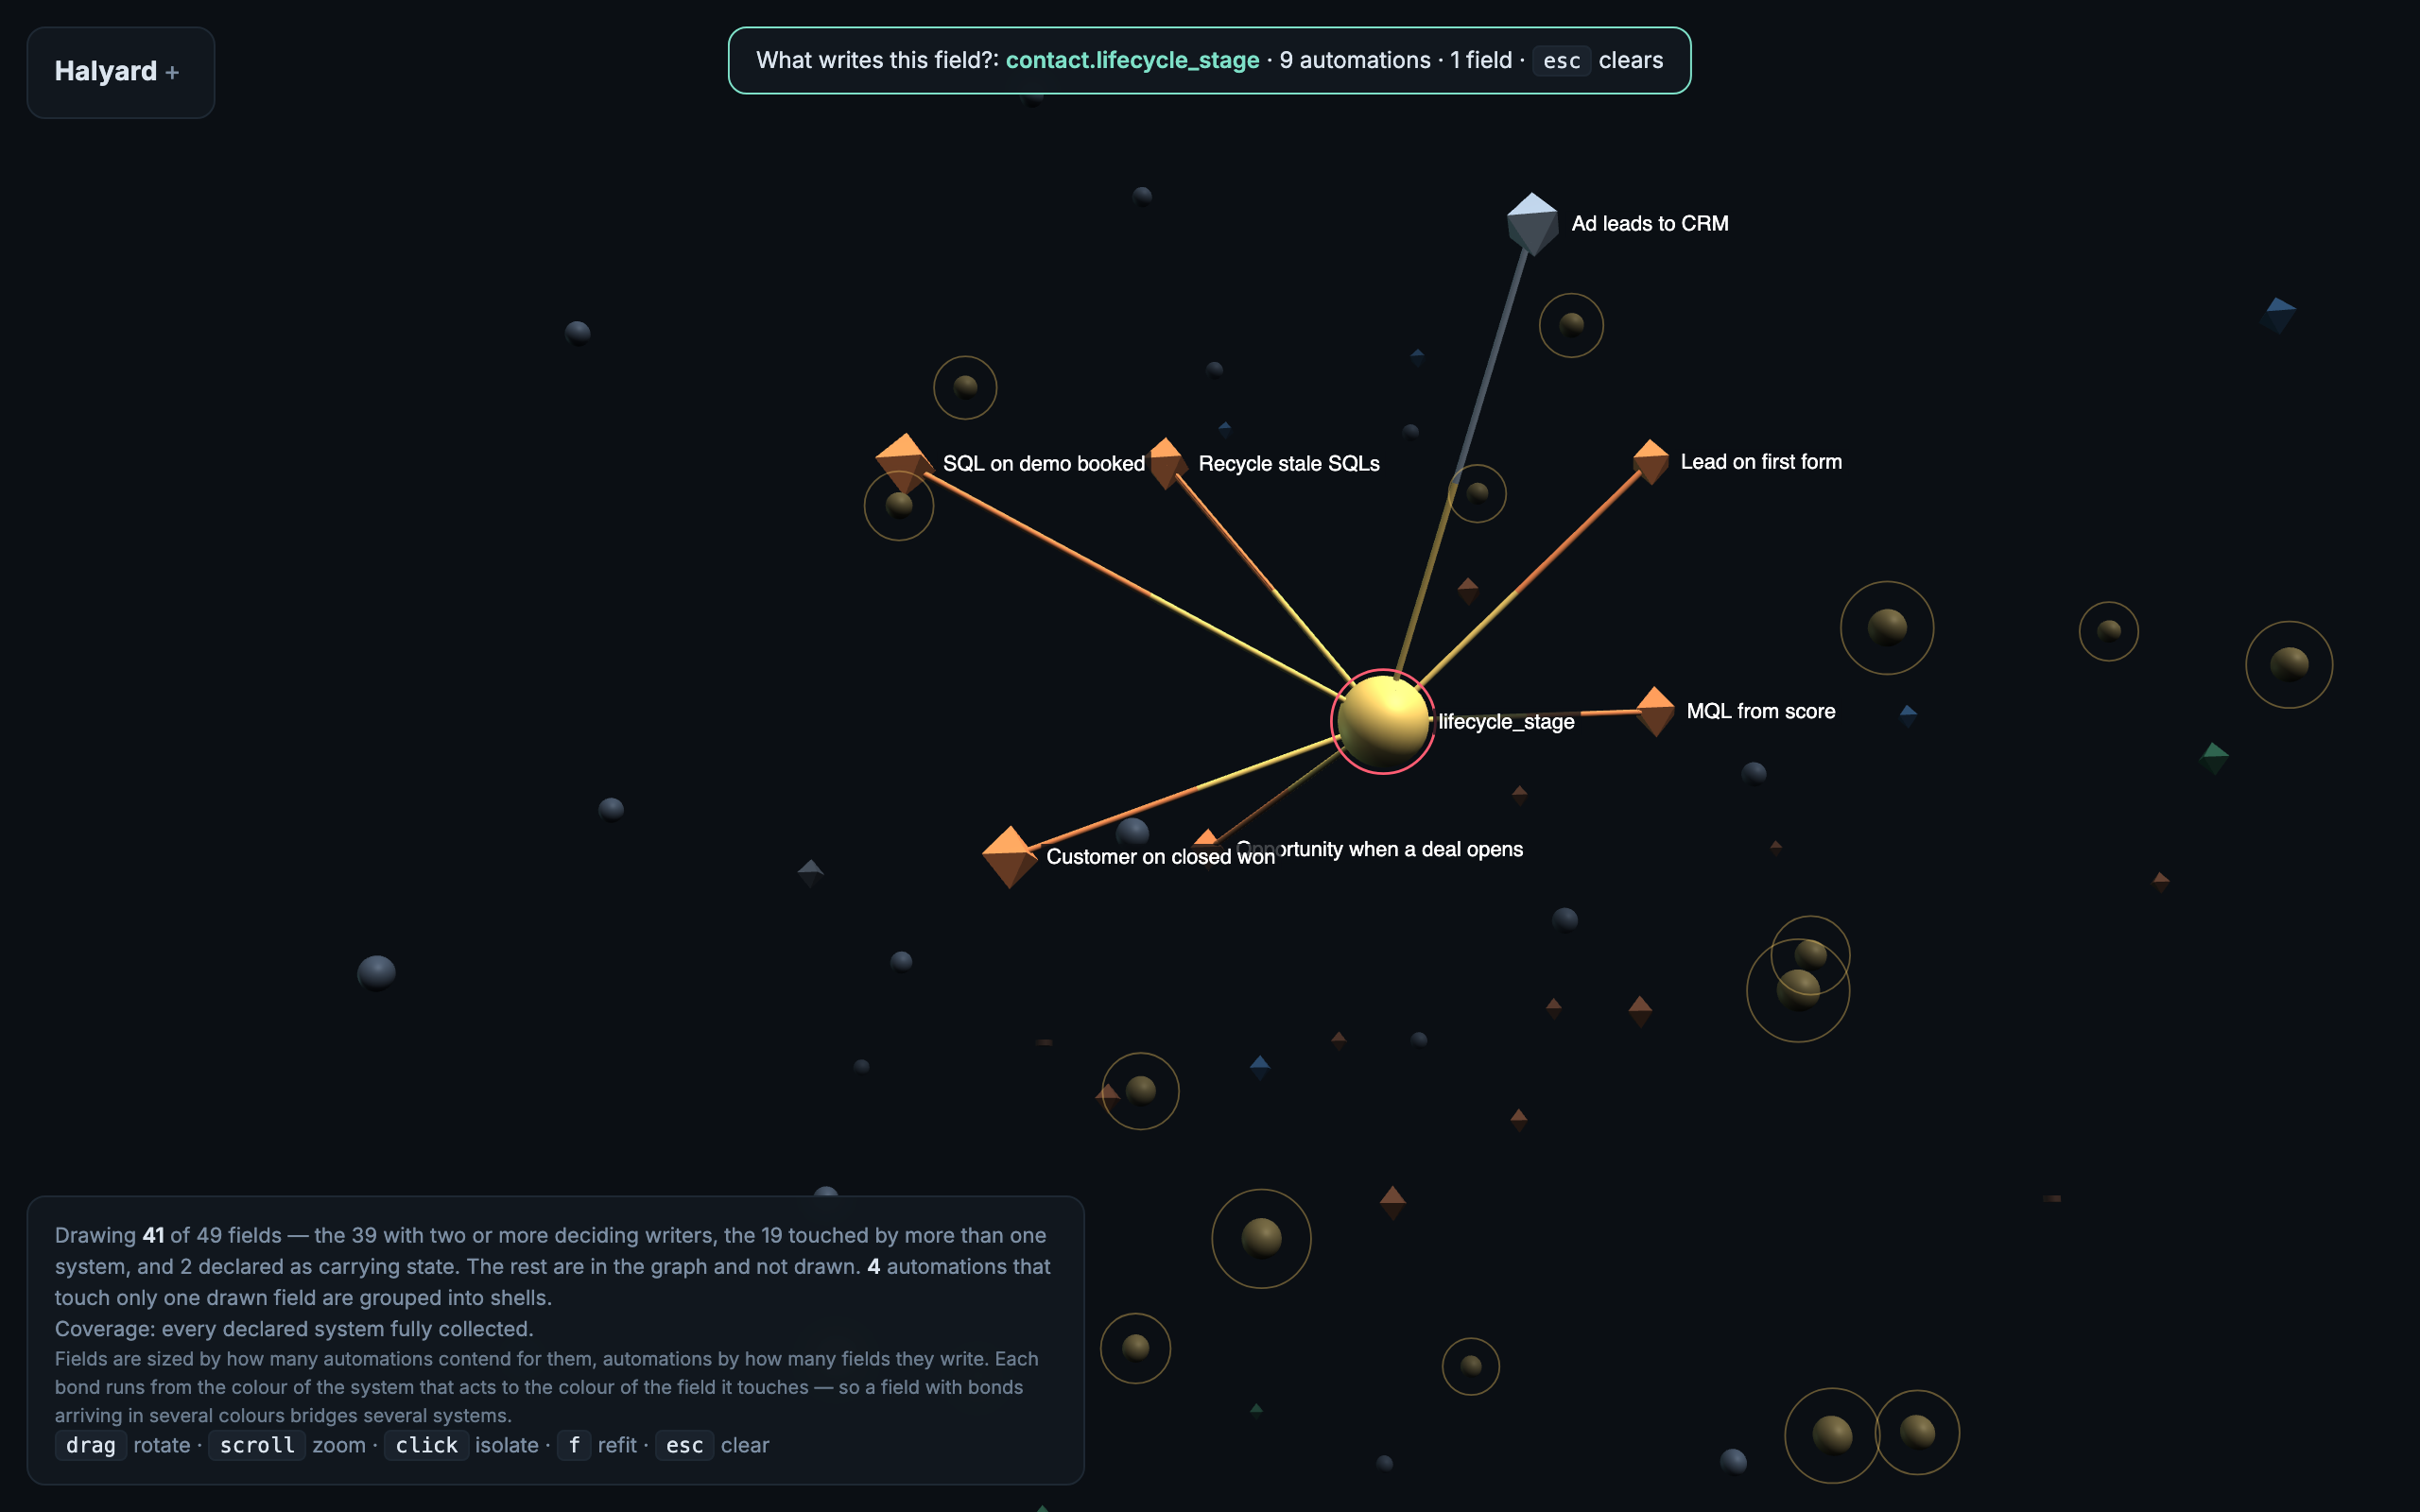
Every drawn field is a sphere, every automation a diamond, and automations that touch only one field fold into shells so a portal with hundreds of workflows stays legible. Toggle systems, objects and property groups; click a field to isolate it; the view remembers where everything was last time so it becomes familiar.
5. The trajectory
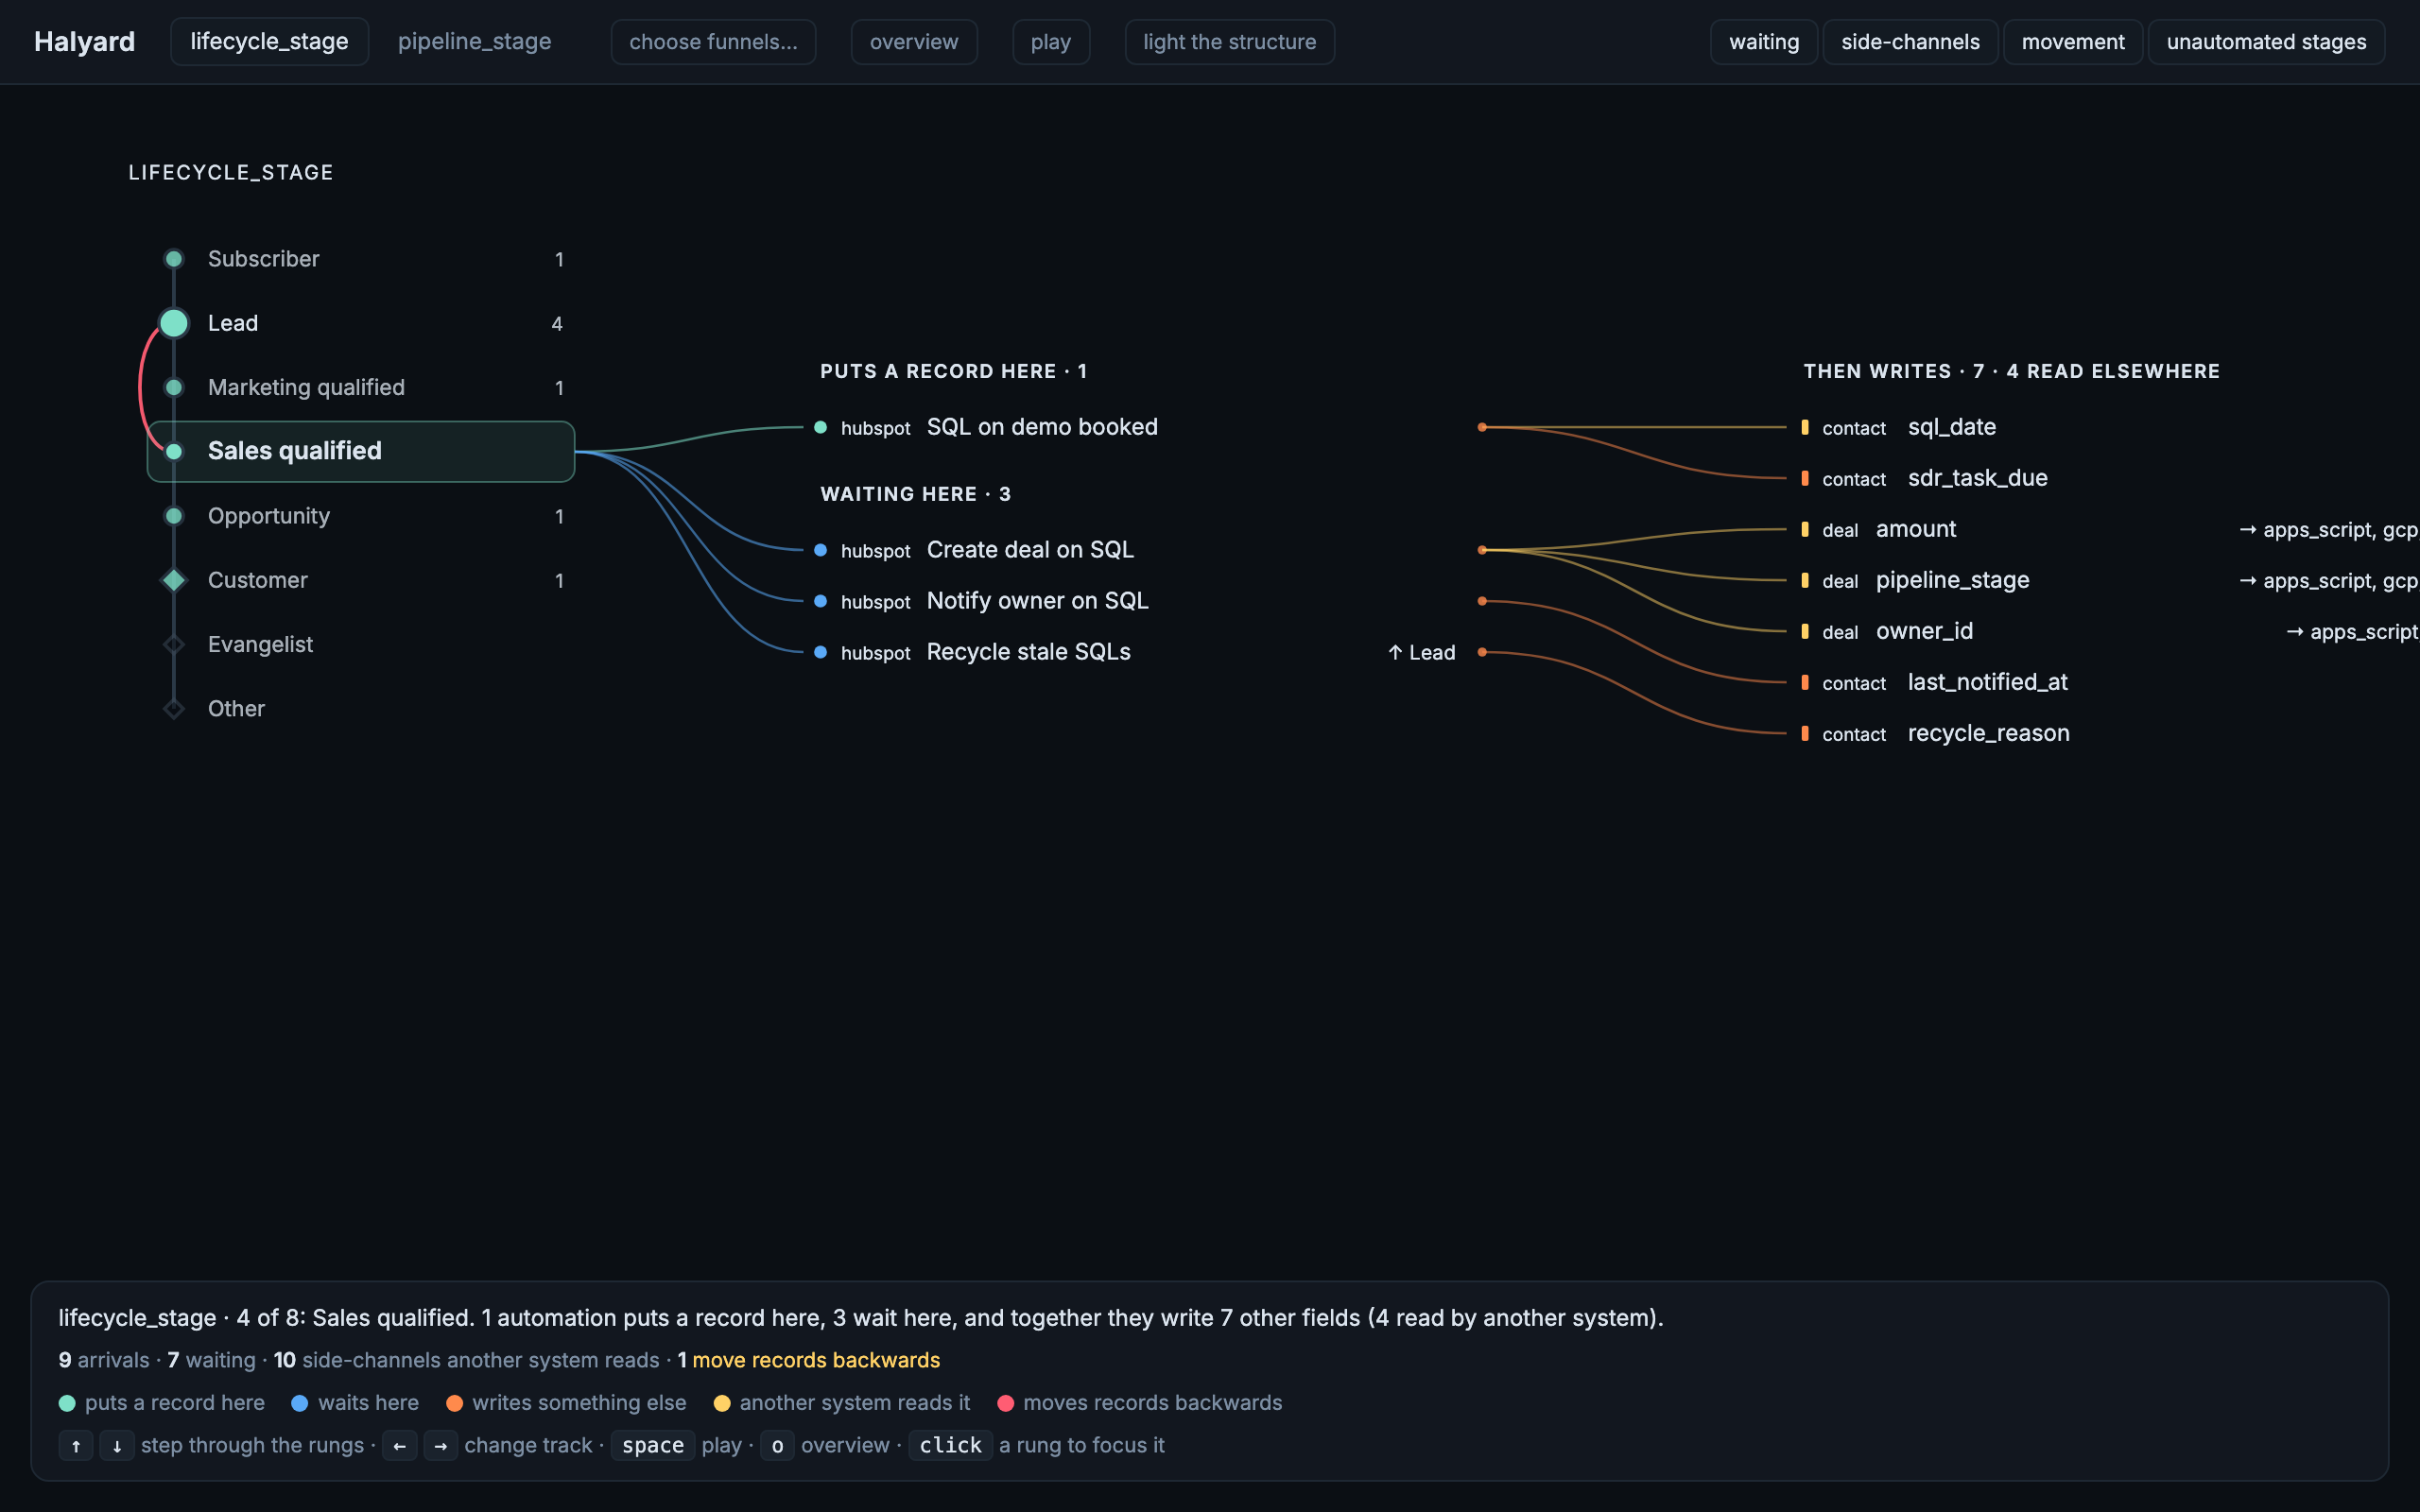
A funnel is a field whose values come in an order. The trajectory draws it as a track and lets you step down it one stage at a time. Arrivals, watchers, side-effects, and the ones that move records backwards. Light the structure from the walk and the two views move together.
6. The roster and the brief
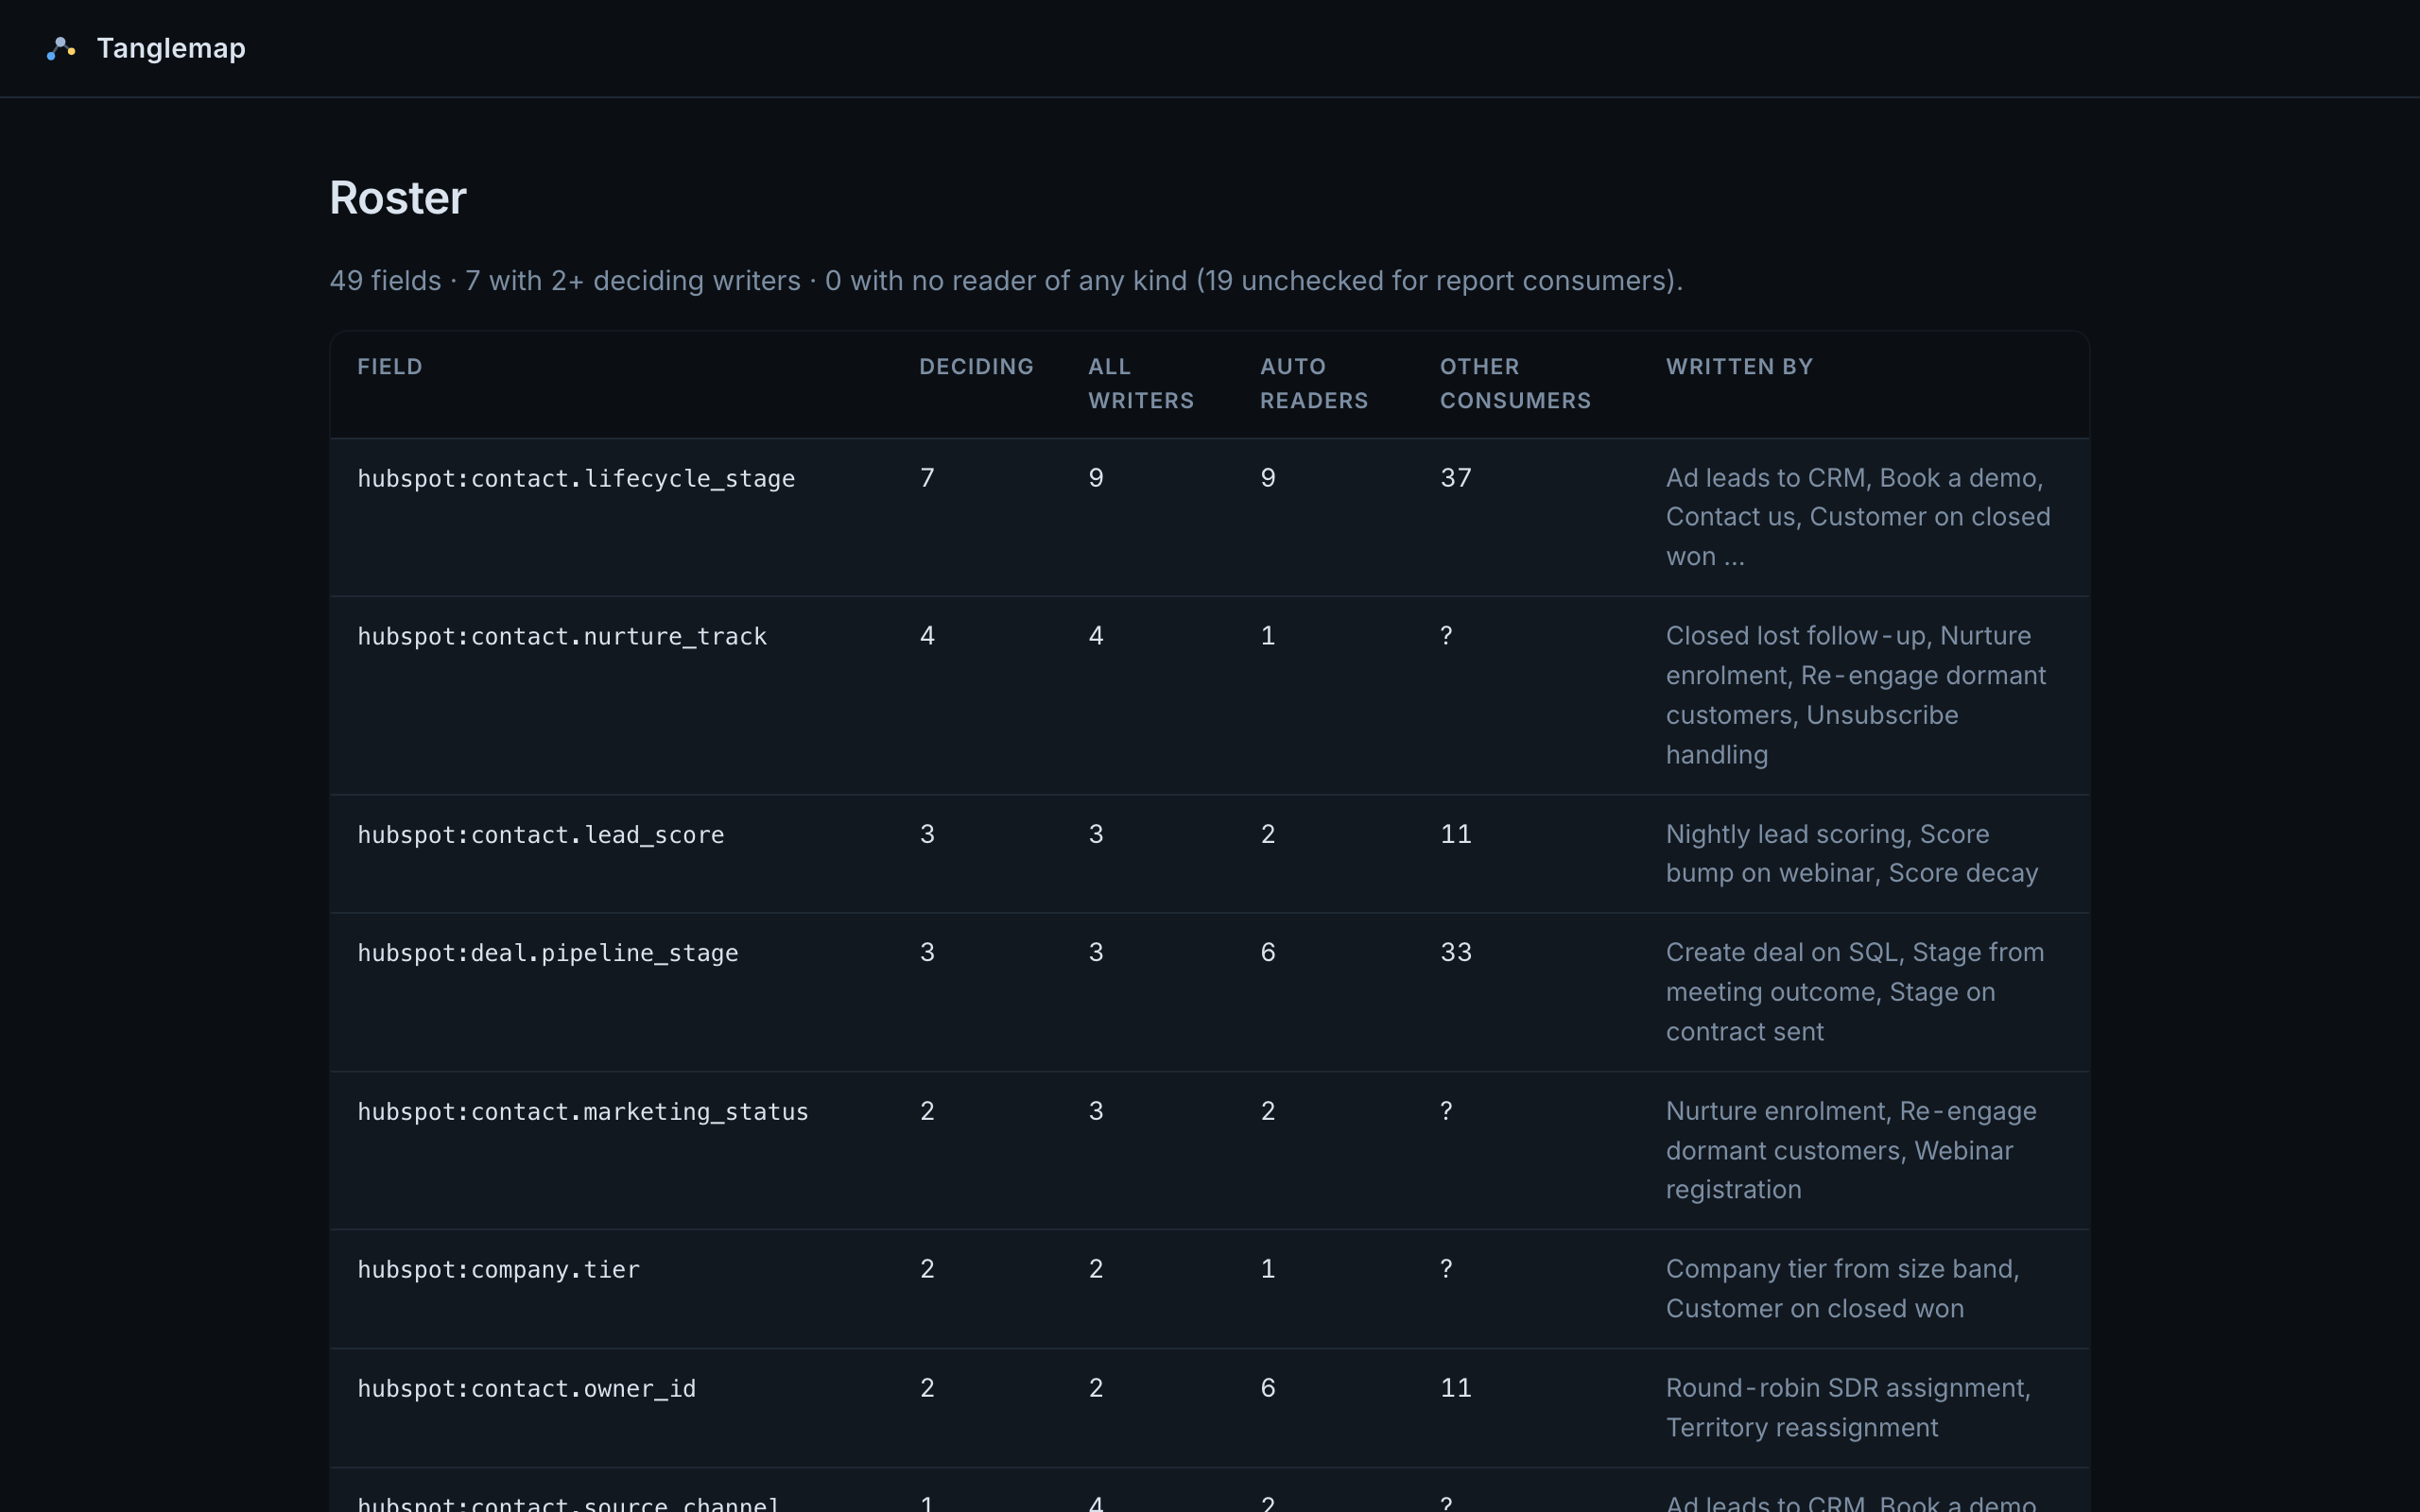
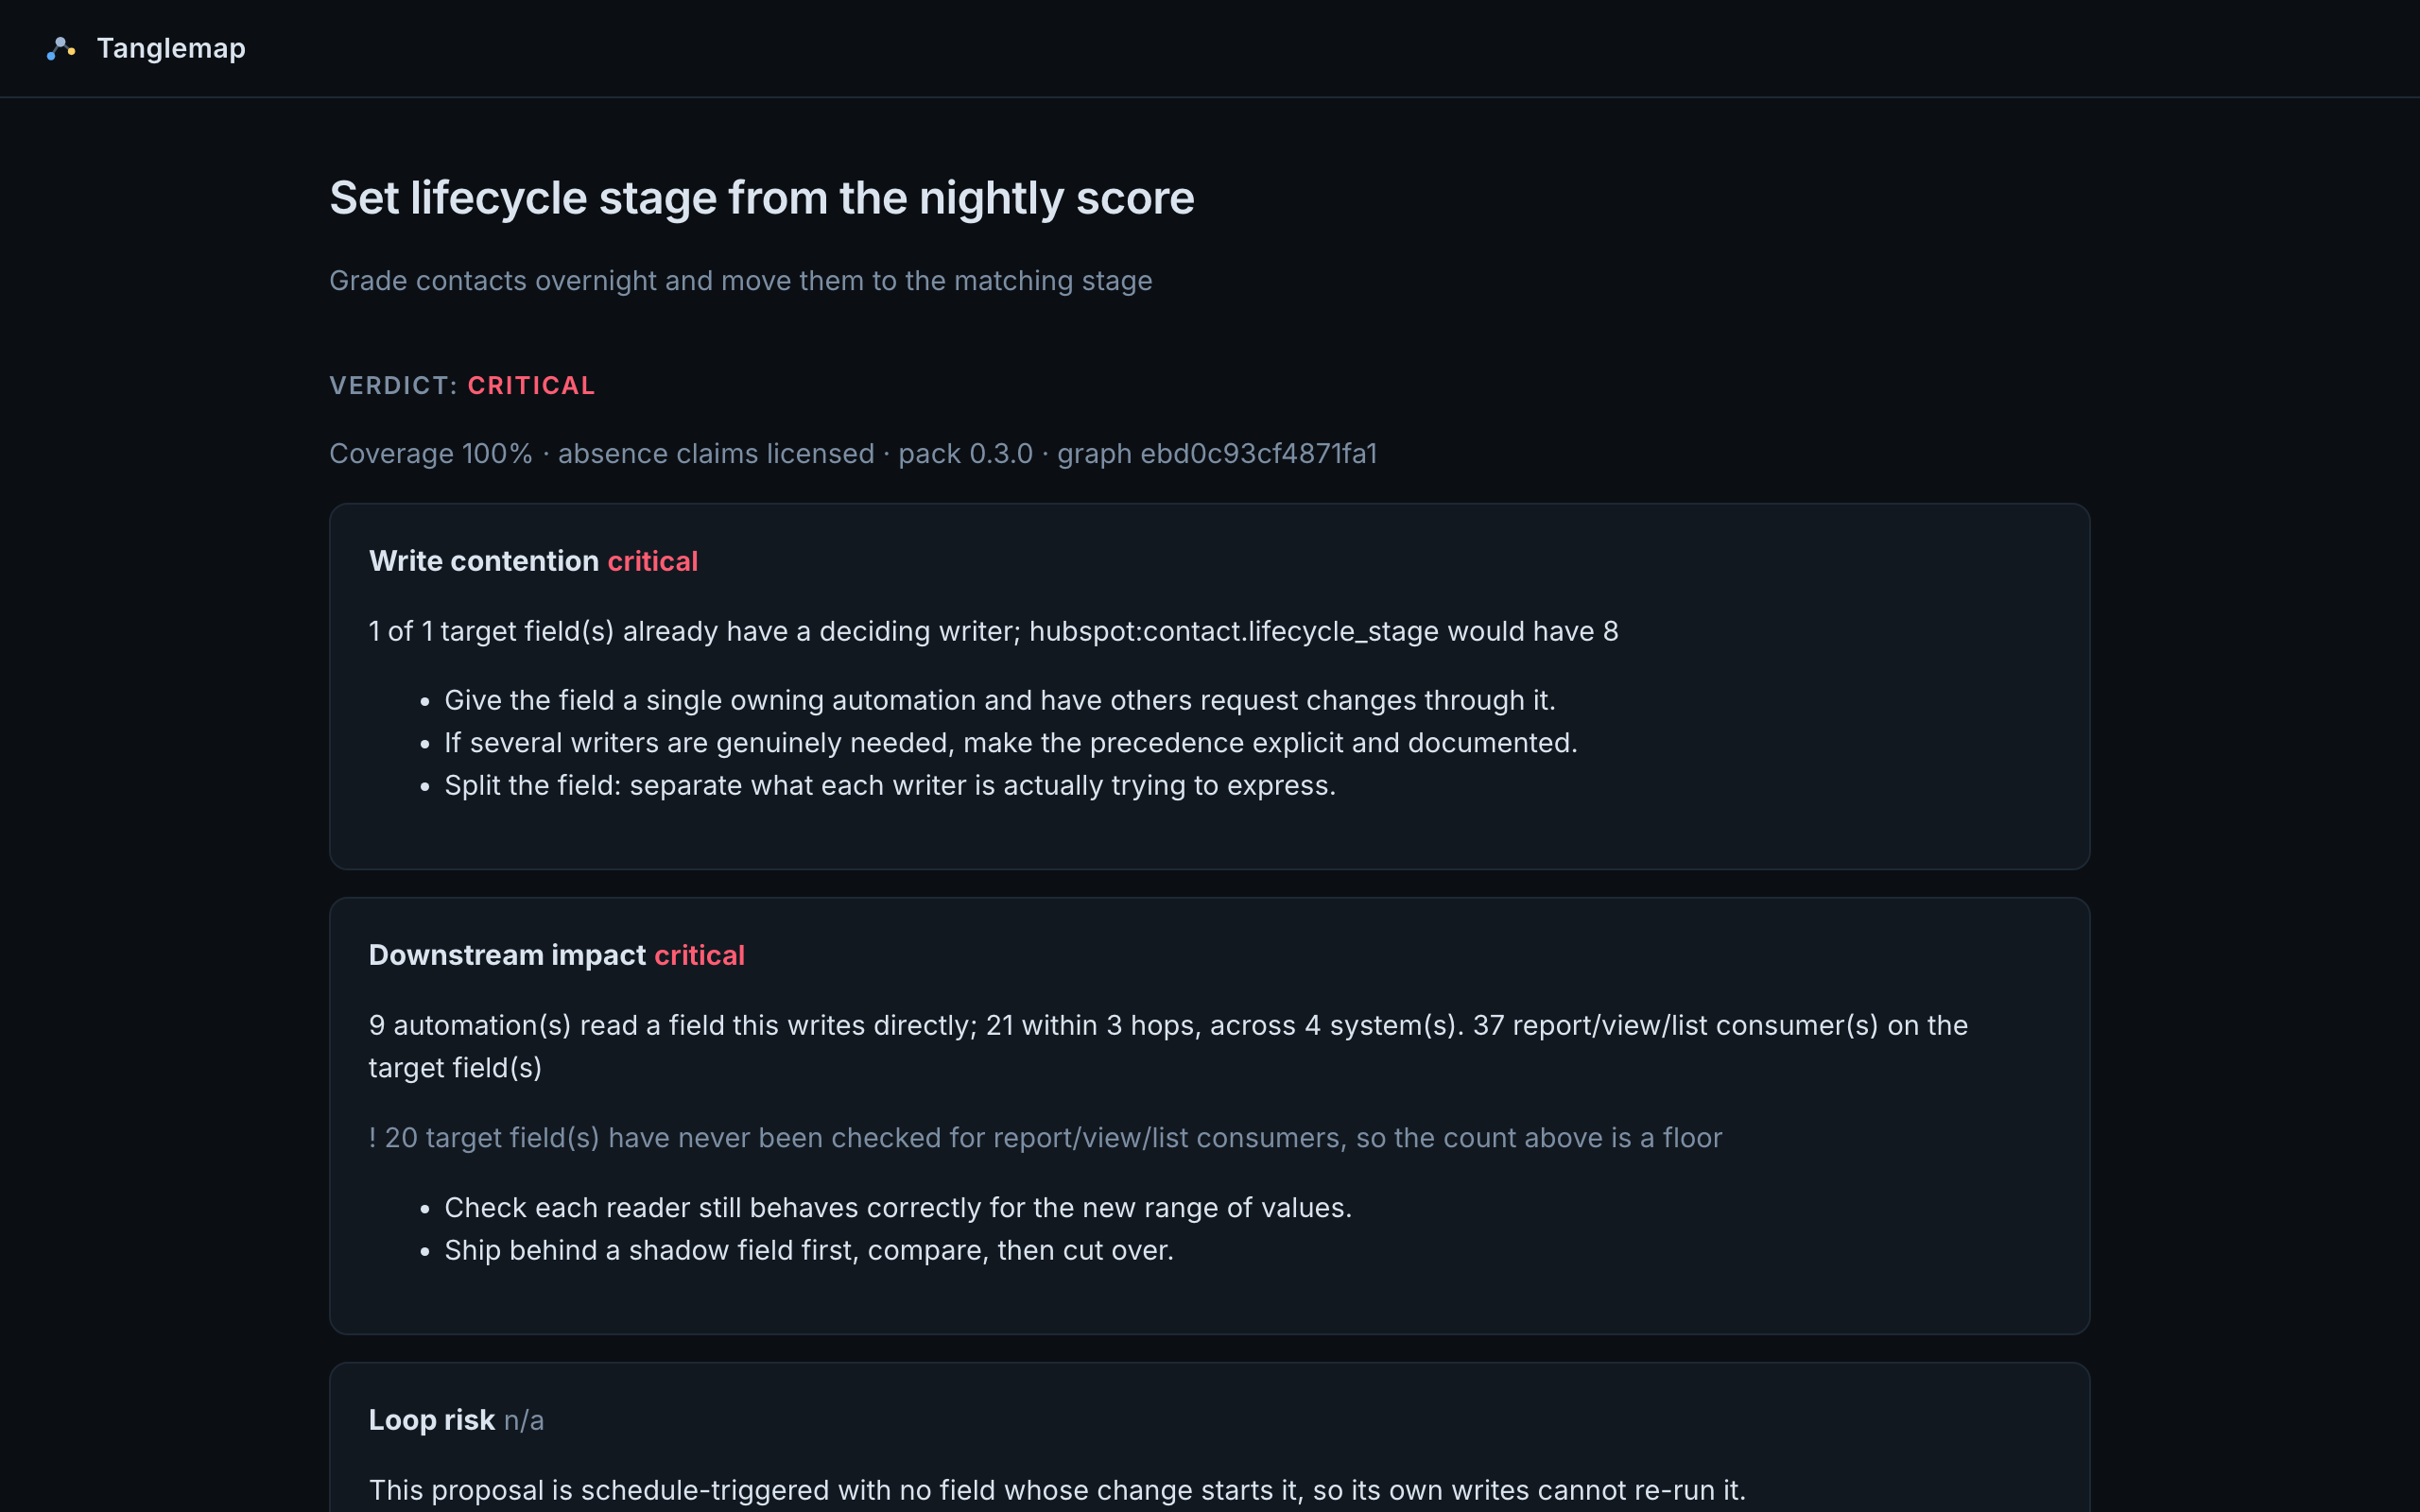
The roster is every field with its deciding writers, its automation readers and its report consumers. The brief is what you get when you describe an automation you have not built yet: six checks, write contention, downstream impact, loop risk, timing and ordering, credential scope and precedent, each with the count behind it and what to do about it.
And an assistant
Every question the views answer is also a tool over MCP, so the assistant you already use can ask them: what would break if I made this write lifecycle stage. The server tells the model, before anything else, to say "not collected" rather than guess. Its answers are the graph's answers.